


This article written by Adam Robinson, Marketing Manager at Cerasis, originally appeared on the Cerasis blog on March 6, 2015
While US manufacturing has been hit hard by nearly two decades of policy failures that have damaged its international competitiveness, it remains a vital part of the U.S. economy.
The US manufacturing sector employed 12 million workers in 2013, or about 8.8 percent of total US employment. Manufacturing employs a higher share of workers without a college degree than the economy overall. On average, non-college-educated workers in manufacturing made 10.9 percent more than similar workers in the rest of the economy in 2012–2013.
The report examines the role manufacturing plays in employment at the national, state, and congressional district levels, including the number of jobs manufacturing supports, the wages those jobs pay, and manufacturing’s contribution to GDP. (This report updates an earlier EPI report but includes U.S. congressional district data for the first time.) The data shows that U.S. manufacturing employment was stable for three decades until 1998, and has been on a largely downward trajectory since then, with traditional manufacturing states hit particularly hard. Given its size and importance, we cannot ignore the consequences of such a decline. Further, the policies that would help manufacturing the most are those that would help close the nation’s large trade deficit. Reducing this trade deficit would, in turn, provide a valuable macroeconomic boost to a U.S. economy that is still operating far below potential.
-
The manufacturing sector has a large footprint in the U.S. economy. It employed 12.0 million workers in 2013, 8.8 percent of total U.S. employment.
-
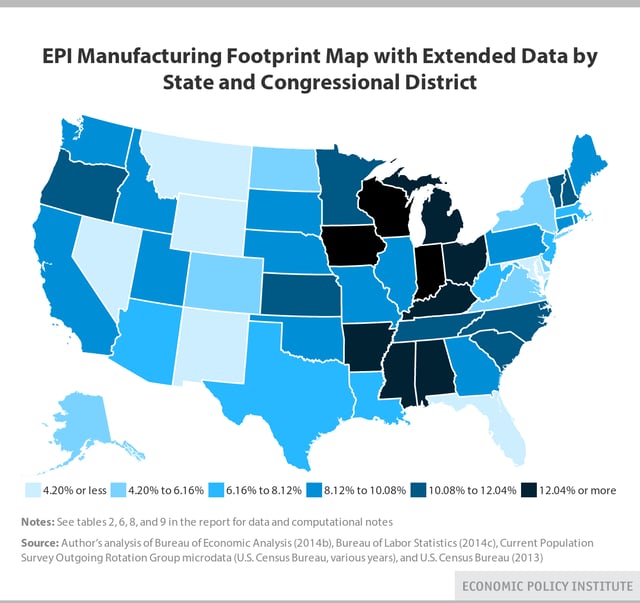
US Manufacturing plays a particularly important role in supporting jobs in a core group of states in the upper Midwest (East North Central and selected West North Central) and South (East South Central) states. The top 10 states ranked by manufacturing’s share of total state employment in 2013 are Indiana (16.8 percent, 491,900 jobs), Wisconsin (16.3 percent, 458,400 jobs), Iowa (14.0 percent, 214,500 jobs), Michigan (13.5 percent, 555,300 jobs), Alabama (13.1 percent, 249,100 jobs), Arkansas (12.9 percent, 152,400 jobs), Ohio (12.6 percent, 662,100 jobs), Kentucky (12.4 percent, 228,600 jobs), Mississippi (12.3 percent, 136,700 jobs), and Kansas (11.9 percent, 162,900 jobs).
-
The top 10 states ranked by total manufacturing employment in 2013 are California (1,251,400 jobs), Texas (871,700 jobs), Ohio (662,100 jobs), Illinois (579,600 jobs), Pennsylvania (563,500 jobs), Michigan (555,300 jobs), Indiana (491,900 jobs), Wisconsin (458,400 jobs), New York (455,100 jobs), and North Carolina (442,500 jobs).
-
The top 10 congressional districts ranked by manufacturing’s share of total district employment are Indiana’s 3rd Congressional District (76,200 jobs, 23.3 percent of district employment), Indiana’s 2nd (73,500 jobs, 23.1 percent), Wisconsin’s 6th (80,000 jobs, 22.6 percent), California’s 17th (63,400 jobs, 19.9 percent), Indiana’s 6th (60,400 jobs, 19.4 percent), Alabama’s 4th (48,500 jobs, 19.2 percent), Wisconsin’s 8th (69,600 jobs, 19.2 percent), Ohio’s 4th (61,000 jobs, 19.0 percent), Michigan’s 2nd (57,500 jobs, 18.6 percent), and Wisconsin’s 5th (66,200 jobs, 17.9 percent).
-
The top 50 congressional districts ranked by share of employment in manufacturing are widely dispersed throughout 16 states, nearly one-third of all the states. The states represented in the top 50 congressional district list include Indiana (seven congressional districts), Michigan (seven), Wisconsin (six), Ohio (five), Alabama (three), Arkansas (three), California (three), Iowa (three), Tennessee (three), Kentucky (two), North Carolina (two), South Carolina (two), Georgia (one), Kansas (one), Mississippi (one), and Oregon (one).
US Manufacturing Interactive Footprint Map
Complete data for employment in each state and for all 435 congressional districts (and the District of Columbia) are also available in the EPI US Manufacturing Footprint Map below. This interactive feature also includes details on employment by state and congressional district in each of 25 unique manufacturing industries.
Manufacturing industries generated $2.1 trillion in GDP (12.5 percent of total U.S. gross domestic product) in 2013. But even these figures do not fully capture manufacturing’s role in the economy. Manufacturing provides a significant source of demand for goods and services in other sectors of the economy, and these sales to other industries are not captured in measures of manufacturing sector GDP but are counted in the broader measure of its gross output. U.S. manufacturing had gross output of $5.9 trillion in 2013, more than one-third (35.4 percent) of U.S. GDP in 2013. Manufacturing is by far the most important sector of the U.S. economy in terms of total output and employment. The manufacturing sector supported approximately 17.1 million indirect jobs in the United States, in addition to the 12.0 million persons directly employed in manufacturing, for a total of 29.1 million jobs directly and indirectly supported, more than one-fifth (21.3 percent) of total U.S. employment in 2013.
The US manufacturing sector is also a particularly important provider of jobs with good wages for workers without a college degree. This can be seen in the manufacturing wage premium—the dollar amount by which the average manufacturing worker wage exceeds the wage of an otherwise comparable worker outside the manufacturing sector. The average wage premium for all U.S. manufacturing workers without a college degree was $1.78 per hour (or 10.9 percent) in 2012–2013.
The United States lost 5.7 million manufacturing jobs between March 1998 and 2013. The principal causes of manufacturing job losses were growing trade deficits, especially with China, Mexico, and other low-wage nations, and the weak recovery from the Great Recession since 2009.
The Great Recession was unusual because of the length and depth of the manufacturing employment decline. Although nearly 800,000 manufacturing jobs have been added since the employment trough, US manufacturing employment remains depressed. If employment had recovered to the level of the average recovery in the post-World War II era, then an additional 1.2 million manufacturing jobs would have been created through the third quarter of 2014. The weak manufacturing recovery is a product of both international and domestic challenges faced by the manufacturing sector. The U.S. trade deficit in manufactured goods has increased sharply since 2009, which has significantly retarded the growth of manufacturing output and employment since the recession. Currency manipulation by China, Japan, and other countries is one of the leading causes of the growing U.S. trade deficit (Scott 2014b). Weak growth of domestic demand is also a major contributor to the relatively weak manufacturing recovery.
The Midwest and some southern states have been particularly hard hit by the collapse of manufacturing since 1998. Those states are also well positioned for a manufacturing recovery if the structural causes of the manufacturing decline are reversed, including by eliminating currency manipulation, which would substantially reduce or eliminate the U.S. trade deficit in manufactured goods. In addition to the growth of the U.S. trade deficit, other structural problems in manufacturing are the stagnation of public investment in infrastructure and in research and development, and inadequate tax, education, and energy policies.
Manufacturing’s footprint: Jobs
In 2013, the U.S. manufacturing sector directly employed 12 million workers, or about 8.8 percent of total U.S. employment.
This report uses a unique data set from the American Community Survey (ACS) to estimate the distribution of employment in each state and congressional district. Estimates of total manufacturing employment for each of 25 industries for each region in 2011 were obtained from the survey and used to develop estimates of the distribution of manufacturing employment in each state in the representative period. Total state employment in manufacturing in 2013 was obtained from the Bureau of Labor Statistics (2014c), and allocated to states, industries, and congressional districts based on the distribution of employment obtained from the ACS (U.S. Census Bureau 2013).

Comments